Wednesday, May 6, 2026

 06-May-26 daytrading plan

Shriram finance : range 961-974

REC : range 356-364

union bank : 162.90-166.90

Tuesday, May 5, 2026

Intraday stocks & levels 5-May-26

05-May-26 Daytrading plan (All levels are valid upto and are recommended to be closed by 12:15 pm)

BEML : seems bullish on DTF. yesterdays close was 1836. todays trading range 1826 to 1854

Union Bank: yesterdays close was 163.77, todays likely range 162.10-167.40 (bit risky as the stock is near its support but the PA is bearish on DTF)

JamnaAuto: seems bullish, yesterdays close 125.21, todays likely range 124.35 - 127.40

Bandhan Bank: Neutral to bullish. may see some profit booking. yesterdays close 206.76. Todays likey range 204.50 to 207.4

Rules for day trading : 

1. Avoid trading if stocks opens flat. Wait for price to approach the range and then enter. 

2. if stock sustains near lower range then we buy with SL of 1% from entry

3. if stock stalls near upper range then we sell with SL of 1% from entry. 

4. Targets are 0.45% , 0.70% & finally 1.20% from entry

5. After 0.70% target is reached. Move your stop to entry (cost to cost).

6. Avoid entry if the stock is unable to reach near trading range entry price by 10:30 am

7. Take just 1 trade per stock and close with either profit or loss as per targets given or by 12:15 pm whichever comes first


EOD performance review of daytrading calls given

BEML seems bullish on DTF. yesterdays close was 1836. todays trading range 1826 to 1854


Union Bank: yesterdays close was 163.77, todays likely range 162.10-167.40 (bit risky as the stock is near its support but the PA is bearish on DTF)

As per range entry was taken near 162.60 tgts 163.33, 163.73 achieved... 164.55 did not achieve

however cost to cost was exited as per rule after 165.73 achieved


JamnaAuto: seems bullish, yesterdays close 125.21, todays likely range 124.35 - 127.40

Entry taken near 124, however 1% SL got hit at 122.76 the stock made a low of 122.30 

The company has received tax demand notice 4 days ago for 1040 lacs hence the stock is under pressure I guess.


Bandhan Bank: Neutral to bullish. may see some profit booking. yesterdays close 206.76. Todays likey range 204.50 to 207.4

Entry at 204.90 all 3 tgts hit 205.82, 206.33, 207.35


Sunday, February 15, 2026

Nifty trading levels for 16-Fb-2026

 Nifty closed at 25471 last friday.

on Monday, we will look at 25535 to 25350 levels to trade. keeping SL of 45 points

Friday, November 17, 2023

Trading plan for 17-Nov-23

NIFTY

Yesterday (16-Nov-23) Nifty (spot) opened at 19674 made a low of 19627 then high of 19875 and closed at 19765.

Todays important levels in the morning session would be around 19750, any weakness in this area is likely to take it down to 19715 to 19705 levels. it will try to bounce back upto 19749 and then may take a plunge again. If 19705 levels are broken then next level would on downside would be 19675 to 19655.

I would be looking for bearish opportunity around 19750 and 19725 for a 20 to 40 point play.

would be buying 19700 PE around 51-54 for target of 69 and SL of 40

R:R: 13 : 16


STOCK

Jindal Steel closed at 647.20 yesterday. formed inside candle with 651.05 as high and 642.50 as low.

secondly 20 sma is pointing downwards and it is resting at 634 so there is ample space between cmp of 647 and 634. it is likely to touch the 20 sma line in coming sessions. Hence my view is bearish on this stock.

If Nifty remains weak, I would be looking to short this stock around 647.90 to 649.9 and cover at 645.10 as the stock seems weak on the charts too. SL will be 652

R:R : 2.5 : 4


Sunday, August 20, 2023

Stock for Aug 2023

19-Aug-2023

UPL : CMP is 578. Watch soon for buying opportunity as ITM PE & OTM CE option writer seems to be closing their positions. 

ITM PE change in open interest is -ve and 

OTM CE volume traded is high but change in open interest is either negligible or -ve

this stock seems to be getting ready to bounce from 520 to 580 range all the way upto to 660+.

Watch this stock for accumulation opportunity at lower levels book profits at 650+ levels upto 674.

Best buy in UPL is at 551 

Best sell is at 649 

keep SL at 485

R:R is 1:1.5 approx


Thursday, October 28, 2021

Positional calls for Q3 2021

Date : 27-Oct-21

Positional for swing trading

Glenmark cmp 503 , 

keep for buying at 466-476, sl 440, tgt 530

trade1 risk= 36 reward 54 (1:1.5)

trade2 risk= 26 reward 54 (1:2.05)


BPCL cmp 428

keep for buying at 422 & 414, sl 410, tgt 444 & 454

trade1 risk= 12 reward 22 (1:1.83)

trade2 risk= 4 reward 40  (1:10)


Performance review as of  2-Dec-21 of Swing trading calls given above.

Glenmark was bought @ 466-476 range on 22-Nov-21 and it reached our target 530 in three days. Giving 12.52% returns in 3 days.

Check the highlighted rows. (source : NSE website)  


BPCL bought in the range of 422-414 on 29-Oct-21

Earned dividend of Rs 5/- on 11-Nov-21. i.e. 1.19% dividend yield on our avg buying price of 418.

Price went down after 11-Nov because of dividend. It hit our stop loss of 410. Made Rs. 8 loss but earned Rs. 5 back. So effective loss was Rs 3/- per share i.e 0.71% loss


Overall performance in our last 4 trades (2 trades each in Glenmark and BPCL) = 12.52 - 0.71 = 11.81% profit in one month.

Thanks. Happy Trading !!!

Saturday, July 4, 2020

July 2020 Trading ideas

Date : 04-Jul-2020
Watch Tech mahendra for buying opportunity at / near 565 for targets 594-604. Stop loss 550

McDowells may take support at / near 570 to bounce back to 599-609-619 levels. Stop loss at 550

Cummins intraday and positional refer the chart shown


Happy trading :)

For more information on stocks trading strategies, mail your request to TradewithLS@gmail.com

Friday, October 4, 2019

Trading Ideas for 4-Oct-2019

Day trading:
ZEEL sell below 248
Target 245.50, 244.10, 242.60, 241.10
Stop loss 250

Short-term trading:
QUESS Corp buy above 465
Target 494, 498, 504, 509, 514, 519
Stop loss 440

Happy Trading !!!

For day trading course & investment course mail me.
TradewithLS@gmail.com

Tuesday, August 13, 2019

Short term Investment: YES BANK

Date: 13-Aug-19

Keep a watch on YES BANK for short-term 
Buy when it reaches between 61-62.50
First Target: 74
Second Target : 89
Stop loss 59

Warm Regards,
Lawrence Sequeira

Sunday, May 26, 2019

Watchlist for June 2019

Date: 05-Jun-2019
Watch Edelweiss stock for buying opportunity. CMP is 200. try to catch it around 175 for target of 240-250 in coming sessions. Stop loss will be 150


Date: 26-May-2019
Our next stock to watch is  Motherson Sumi CMP is 118. Results will out on 27th May, 2019. Will take a look soon after and update the trading strategy.
Currently it seems to be best buy at 106-111 for target of 144-149. Stop loss will be 100.

Tuesday, May 7, 2019

Watchlist for May 2019

Date: 06-May-2019

I came across an interesting stock.... L & T Finance Holdings and saw what brokers have to say about this stock on the moneycontrol site.

First lets look at the charts background : I saw the technical chart of the stock and it seemed to be trading very close to its support level of 110. The current price is 123.70 the Volume has also fallen as the stock makes new lows. This could mean that the selling is drying up and there may be a bounce back coming soon. Have a look at the chart.

L & T Finance Price Chart.... Look at the arrow showing reduced volume for new low
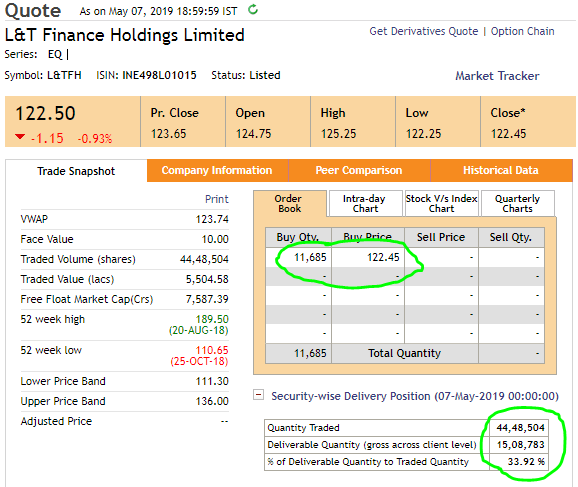
Here is the quote from NSE site.


As you can see the 52 week low was 110.65 and the current price is 123.65

I got interested in this stock, but I wanted to be sure there are no negative news about this stock. So I quickly checked the moneycontrol site News section and this is what I found....

The figures seem great and I wanted to check what brokers are saying about this stock to I filtered for brokers recommendations and this is what I saw ...


Surprised to see there was none talking about this stock.

What do I do now? I am tempted to trade this stock and I am kind of getting this feeling that the stock is likely to stall its free fall and soon it will pick up. but where do I place my trade? I turned towards the Option chain to find clues and this is what I saw.....


I saw that option chain is confirming the 110 level as the next support and 140 level as the highest churning of open positions being squared off by call writers. That gave me the clue that I need to start watching for buying opportunity.

Now I wanted to know the range in which I can catch the stock. For this I wanted to check the ATR (Avg. True Range)  of the stock. So I visited Icharts site and checked the weekly chart and this is what I got ....


I saw that the ATR was 9.22 and the True range was 4.75

I collected all this information and came up with a trading plan as follows:

Support level = 101-110
Resistance level = 140-149
Current price = 123
Best buy expected at True Range approximation = 120.10, 115.10, 111.10, 106, 101
If we cannot get the fill at our best buy prices above then we buy at breakouts of previous days close.
Target prices will be : 134, 139, 144, 149
In general the stop loss will be 10 points from our buying price (taking ATR into consideration).
Hard stop loss price will be at 100 always even if I buy at 101 the stop loss will be 100
Reward will be 14 to 29 points from my buying price.

Lets see how this trade comes along.

Edit: 08-May-19

Yesterday L&TFH opened at 124.75 which was Rs. 1.10 above the previous days close. This could be an indication of institutional buyers/brokers are testing this price to enter the stock. During the day it did try to cross 125, went upto 125.25 but was unable to sustain there for long. Selling orders started pouring in the moment stock tried to climb. This calls for wait and watch policy. However I did make an intraday trade as per my trading plan and saw opportunity to get in and out at 124 and 124.90 respectively.
I closed the day by entering a delivery order at 122.60. The stock made a low of 122.25 and closed at 122.45. Since I made a profit on the intraday trade of .90 ps my effective buying price is 122.60-.90 = 121.70 per share. As per my trading plan given in yesterdays post, the plan still looks good to be in force and there are no changes needed.

Have a look at the EOD snapshot given below. In the first screenshot you will notice there are 11,685 buying orders outstanding at the close of the day and about 33% of the volume is delivery. In the second screenshot you will notice the volume traded was lesser than yesterdays volume. Could this mean that overall sellers are becoming lesser and lesser as price goes lower and lower and the institutional buyers have started taking delivery? Yes it seems so.

May be, we are right in our assumption that the stock is getting ready for a bounce back.

Anyway, lets keep a close watch and see what comes along.


I now would be keen to see the 120-121 levels today and see if I can make another intraday trade between 120.20 to 122.40 price levels

Edit: 09-May-19

Yesterday L&TFH opened at 122.35 which was .10 ps lower than the previous close of 122.45
It did try to go higher than 123 but could reach only upto 123.05 and started to show struggle soon afterwards. It could not sustain 120 price too and broke it to reach 118.50 rapidly before closing at
118.75. The selling outstanding orders were relatively less as compared to buying order the previous day indicating that sellers are not willing to part with the stock at such a low price. They still are living in hope that the stock will bounce back. So am I, am I correct? I am waiting to buy more qty at cheapest rate possible. I bought some at 121 and was hoping to offload some qty at 122.40/122.90 but the trade did not revive, in fact it started going down and it closed at 118.75. I am stuck with this stock now with two trades made. My buying price has been 121.70 and 121. Let us see what levels we see in the coming days.


The stock is nearing its 52 week low of 110. The Volume was much higher and so was the delivery volume. Yesterday we saw the delivery volume was about 15 lacs shares today we see it has gone upto 25 lac shares. That means someone is buying more and more qty as retailers are panicking and selling. The professional traders are beating down the price lower and lower trying their best to create panic so that they can buy at wholesale prices.


Check how the intraday volume has grown from 44 lacs to 62 lacs shares traded. Check the 2 weeks high is at 140.80 and low is at 118.50

Let us see what option data is telling us


The 127.50 to 135 price level on option chain seem to show lot of trades being unwound on CALL side, why is that so? 125 has added more open interest than any other CALL. Does that mean that the stock is going to remain subdued between 110 and 125 level in the coming days? May be, I don't know.

On the PUT side, I see fresh positions being taken between 110 and 100 levels and the DITM PUTS are showing unwinding. This seems to be creating a window of 100-130
The 110 level is still holding fort as we see highest open interest PUT additions there.

Some more snapshots of this stock


ATR is increasing as you can see in the image above. Professional traders are pouncing on the retailers to sell in panic so that they can buy at lower prices.


The yesterdays VWAP price being 120.17,  Keeping in mind the approximation of 5 points ATR from the VWAP price and the downside pressure being more currently. Key prices levels I would be watching to place my trade today is 112 to 115 on the downside and 119 to 122.40 on the upside.

Edit: 10-May-19

Yesterday I had mentioned about key levels to watch for the day. It turns out that our stock respected those levels. It opened at exactly the same price where it closed on the previous day that is at 118.75 I had mentioned that the selling pressure will see the stock going down upto 115/112, but you know what, I was wrong in that guess. However I also had mentioned that on the upper side it may go upto 122.40 and the stock did try to touch our price. Have a look...


 Check the traded volume and the delivery qty. Keep close watch on those figures in the coming days. Right now all that I can say is that the short-sellers / sellers are in a state of pain because they really want the stock to go down.

Lets see what the option data is telling us.


Highest unwinding of open positions can be seen at 135 CALL and similarly 115 PUT seem to show some unwinding as we see the trades are high but the open interest has not added up. This means that those who wrote those options are unwinding their positions.

The stock seem to be going for 115 on the downside and 135 on the upside in the coming sessions. Lets see how it plays out.

Trading range today is likely to be 117.60 to 127.40

Edit 12-May-19
On Friday we saw the stock trading in a tight range.
It opened at 120.50 which was .25 lower than previous close of 120.75. It went down .90 ps at 119.60
and started moving up to 122.95 but spent the rest of the day deciding what to do as both the buyers and sellers were unsure of the stocks next likely move. It remained within that range and closed at 120.50

Given below is the chart predicting the stocks likely next move....
Blue box indicates buyers overcoming sellers, Orange box indicates consolidation range, Green lines indicate the likely path of the stock


Check out the deliverable qty in the screen above.... it is 23 lacs shares as compared to 11 lacs shares on the previous day. Does that mean buyers are taking delivery of the stock as sellers are selling?

Here is the option chain data...


Look at 130 CALL showing highest traded volume and open interest unwinding. This happens to be the first sign that if markets remain positive then this stock might try to climb further from the current price of 120.75 to somewhere in the range of 129-135
However on the PUT side, unwinding is less prevalent, in fact it looks like writers have commenced writing OTM PUTS, check the range 120-100.

Trading levels for the coming week :

If the stock sustains above 122.50 without breaking 118, we are likely to witness a 10 point move from the CMP 120.50 to upto 129.90 / 134.90

Lets see how it turns out.

Happy trading !!!

Mail me TradewithLS@gmail.com if you wish to get trained in my trading strategies.

Saturday, April 13, 2019

Watchlist for April 2019

Hi,

Watch Hero Motocorp Ltd. (NSE symbol:HEROMOTOCO )


The stock closed on 2639. It is likely to try for 2740-49 and 2790-99 in coming sessions.

Best buying range @ 2610-2625. If unable to get it at this price then Buy when it crosses 2650
Stop loss @ 2600
First Target @ 2740 to 2749 (sell 50% qty)
Trail stop loss @ 2700
Second Target @ 2790 to 2799 (sell the remaining qty)

Risk : 10-50 points
Reward : 115-174 points

Expected holding period: 45 days

Edit : 16-Apr-2019

Hope you were able to make some money as per my recommendations above given on 12-Apr-2019. The stock gave buying opportunity at 2650 on 15-Apr-2019 and today it hit the first target of 2749 as predicted. Hope you were able to offload 50% qty at this price. Now move your stop loss to 2700 for the remaining qty and book profits when the price reaches our second target of 2790-2799

Here is the snapshot of the prices after our recommendation


Edit: 19-Apr-19

Market tanked a bit because of the Jet Airways fiasco. However our stock attempted a new high of 2759.90 but was not able to sustain there. it made a low of 2732 closed at its opening price of 2742. this shows signs of selling coming in. We will have to move our stop loss from 2700 to 2725 in order to protect our profitable position.
We had entered at 2650 and have sold 50% qty at 2749 making 99 points profit on that one, now for the remaining qty we will move our stop loss to 2725 so that we get 75 points profit from our buying price of 2650.

Here is the snapshot of the prices.


Edit: 23-Apr-19
Yesterday, that is 22-Apr-19, Hero Moto stock nose dived the way it was predicted. Good we trailed our stop loss to 2725. It got hit and it went further down to touch a low of 2685.
we are out of this stock now with a total of 99 + 75 = 174 points divided by 2  = 87 points average profit from our buying price of 2650. this trade gave us a profit of 3.28% in 9 days. This works out to an ROI of 170% p.a. 


Happy Trading !!!

Mail : TradewithLS@gmail.com to get trained on my Day trading & Investing strategies.

Sunday, October 21, 2018

Oct 2018 watchlist update # 2

Hi,

Watch this stock, seems to have caught attention of buyers. look at the delivery %. its showing 96%. Stock is trading very near to its 52 week low and yet 96 % delivery .... sounds like good amount of buying is coming in. (source : nse website)

Let us wait and watch to see what happens to this stock in the coming weeks.


An here is the weekly chart of Ganesh Housing Corporation Ltd.(source : icharts.in)
Looks like if  61-66 price level holds and the overall market remains positive then It may try to touch 89-99 in the coming months
Best buy would be @ around 62-67 levels. The True Range and avg weekly ATR is around 7 & 10 respectively, 
Hence our targets & stop loss workout to : Target 74-79-84-89-94-99  & Stop loss would be @ 60
Expected time for all targets to achieve is 12-15 weeks


Happy Trading :)

Lawrence Sequeira

Tuesday, October 16, 2018

Some October 2018 Picks... Part # 1

Hi,

Have a look at this stock.... if overall market remains positive then this stock is likely to continue its upside movement too. 


The quarterly results also seem to be good and there is a dividend coming up ex. date 23-Oct-2018


From the current market price of 69 the best buy would be around 60 for targets of 74-89 in near future. Keep stop loss @ 50

Happy Trading !!!

Tuesday, September 4, 2018

Trade # 2 for 4-Sep-2018

Hi,

Another stock to watch is SMS Pharmaceuticals Limited


Looking at the price and volume pattern it looks like many have got attracted to this stock. It seems to be fresh in terms on volume play.
People who missed out will try to enter.

The stock has touched a high of 91.50 yesterday 

Quick intraday strategy trade would be :
Buy above 91.55 for target of Rs. 5/- 10/- from the days low or VWAP.
expect the stock to reach 99 if it breaks above 91.50 

For short term bet the best buy is around 76-81 for target of 99-119. 
Stop loss would be at 70

Warm Regards,
Lawrence Sequeira

Trades for 4-Sep-2018

Hi,

Network18 Media & Investments Limited 
 
DateSymbolSeriesOpenHighLowLTPCloseVolumeTurnover
(in Lakhs)
03-Sep-2018NETWORK18EQ47.9554.8047.6053.8053.7093,34,5444,937.67
31-Aug-2018NETWORK18EQ45.4048.2544.8048.0047.5522,00,0771,031.44
30-Aug-2018NETWORK18EQ45.2046.5045.0045.0545.104,92,085224.73
29-Aug-2018NETWORK18EQ43.4046.1043.2045.6045.708,75,083392.96
28-Aug-2018NETWORK18EQ44.3044.3043.2543.4543.401,74,84476.49

Stock seems to have given a good bounce with volumes from 43-47 level and it may try to go higher upto its 52 week high of 64.10 made on 15-Jan-18.

Its VWAP on 3rd Sept was 52.89

Trading levels for NETWORK18 :
If the stock opens anywhere between 53 and 54.80
Immediate first trade would be Buy at 55 and Sell 50% qty at 57.4
Sell the rest at / near 59.80-62.3

If the stock opens higher than 54.80
Wait and watch for Buy at 55.10 and Sell 100% qty at 55.80

Warm Regards,
Lawrence Sequeira

Friday, October 13, 2017

HDFC Analysis for Oct 2017 series

Date: 13-Oct-17
HDFC at last close is at 1755
Going by the options activity and the traders footprints on the chart, it seems more likely to target 1779-1789-1799 in the coming sessions.
Stop loss could be at 1740.

If you feel like it short the DITM 1800 OCT PUT and hedge it with OTM 1800 OCT CALL.
If you are lucky enough and HDFC stays afloat 1800+ in october series you may end up making 23,000/- on a margin of approx 90,000/- a clean 26% within two weeks ....

Happy Trading !!!


Saturday, September 2, 2017

Random picks for Sept 2017

Date: 02-Sep-2017

Watch for buying opportunities in the following stocks :

1. Axis Bank is currently at 507, best buy would be at 506 for a target of 514,519 & 539 in coming days. Stop loss should be at 500.
Potential profit is 1.58% to 6.52%. Potential Loss could be : 1.18%


2. SBI is currently at 278, if it crosses over 282.5 comfortably then the stock may try to reach 289-294 & 299 in coming days. Stop loss should be at 275
Potential profit is 2.30% to 5.84%. Potential Loss could be : 2.65%


3. Bank of Baroda is currently at 138, if it crosses over 141 comfortably then the stock may try to reach 149-154 & 159 in coming days. Stop loss should be at 135.
Potential profit is 5% to 12%. Potential Loss could be : 4.25%

Happy Trading !!!


Date: 08-Oct-2017
Trade update of above recommendations:
1. Axisbank : Achieved our target of 514 and 519 : Profit 2.56%
2. Statebank (SBIN) : No trade as the stock did not cross our trigger price of 282.5
3. Bank of Baroda: Achieved our target of 149 : Profit 5%

Sept 2017 ROI : Profit 7.56%