Date: 06-May-2019
I came across an interesting stock.... L & T Finance Holdings and saw what brokers have to say about this stock on the moneycontrol site.
First lets look at the charts background : I saw the technical chart of the stock and it seemed to be trading very close to its support level of 110. The current price is 123.70 the Volume has also fallen as the stock makes new lows. This could mean that the selling is drying up and there may be a bounce back coming soon. Have a look at the chart.
 |
| L & T Finance Price Chart.... Look at the arrow showing reduced volume for new low |
Here is the quote from NSE site.
As you can see the 52 week low was 110.65 and the current price is 123.65
I got interested in this stock, but I wanted to be sure there are no negative news about this stock. So I quickly checked the moneycontrol site News section and this is what I found....
The figures seem great and I wanted to check what brokers are saying about this stock to I filtered for brokers recommendations and this is what I saw ...
Surprised to see there was none talking about this stock.
What do I do now? I am tempted to trade this stock and I am kind of getting this feeling that the stock is likely to stall its free fall and soon it will pick up. but where do I place my trade? I turned towards the Option chain to find clues and this is what I saw.....
I saw that option chain is confirming the 110 level as the next support and 140 level as the highest churning of open positions being squared off by call writers. That gave me the clue that I need to start watching for buying opportunity.
Now I wanted to know the range in which I can catch the stock. For this I wanted to check the ATR (Avg. True Range) of the stock. So I visited Icharts site and checked the weekly chart and this is what I got ....
I saw that the ATR was 9.22 and the True range was 4.75
I collected all this information and came up with a trading plan as follows:
Support level = 101-110
Resistance level = 140-149
Current price = 123
Best buy expected at True Range approximation = 120.10, 115.10, 111.10, 106, 101
If we cannot get the fill at our best buy prices above then we buy at breakouts of previous days close.
Target prices will be : 134, 139, 144, 149
In general the stop loss will be 10 points from our buying price (taking ATR into consideration).
Hard stop loss price will be at 100 always even if I buy at 101 the stop loss will be 100
Reward will be 14 to 29 points from my buying price.
Lets see how this trade comes along.
Edit: 08-May-19
Yesterday L&TFH opened at 124.75 which was Rs. 1.10 above the previous days close. This could be an indication of institutional buyers/brokers are testing this price to enter the stock. During the day it did try to cross 125, went upto 125.25 but was unable to sustain there for long. Selling orders started pouring in the moment stock tried to climb. This calls for wait and watch policy. However I did make an intraday trade as per my trading plan and saw opportunity to get in and out at 124 and 124.90 respectively.
I closed the day by entering a delivery order at 122.60. The stock made a low of 122.25 and closed at 122.45. Since I made a profit on the intraday trade of .90 ps my effective buying price is 122.60-.90 = 121.70 per share. As per my trading plan given in yesterdays post, the plan still looks good to be in force and there are no changes needed.
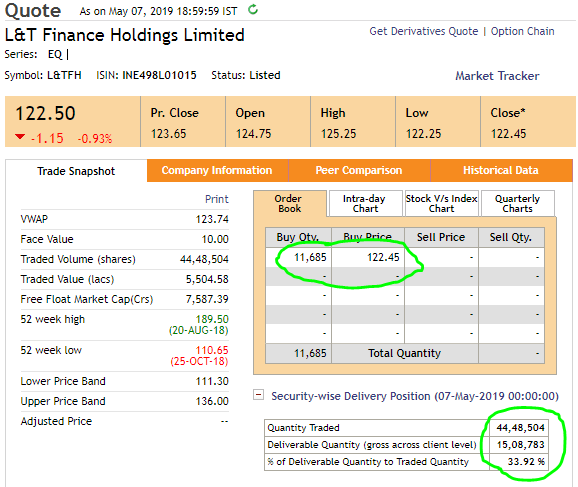
Have a look at the EOD snapshot given below. In the first screenshot you will notice there are 11,685 buying orders outstanding at the close of the day and about 33% of the volume is delivery. In the second screenshot you will notice the volume traded was lesser than yesterdays volume. Could this mean that overall sellers are becoming lesser and lesser as price goes lower and lower and the institutional buyers have started taking delivery? Yes it seems so.
May be, we are right in our assumption that the stock is getting ready for a bounce back.
Anyway, lets keep a close watch and see what comes along.
I now would be keen to see the 120-121 levels today and see if I can make another intraday trade between 120.20 to 122.40 price levels
Edit: 09-May-19
Yesterday L&TFH opened at 122.35 which was .10 ps lower than the previous close of 122.45
It did try to go higher than 123 but could reach only upto 123.05 and started to show struggle soon afterwards. It could not sustain 120 price too and broke it to reach 118.50 rapidly before closing at
118.75. The selling outstanding orders were relatively less as compared to buying order the previous day indicating that sellers are not willing to part with the stock at such a low price. They still are living in hope that the stock will bounce back. So am I, am I correct? I am waiting to buy more qty at cheapest rate possible. I bought some at 121 and was hoping to offload some qty at 122.40/122.90 but the trade did not revive, in fact it started going down and it closed at 118.75. I am stuck with this stock now with two trades made. My buying price has been 121.70 and 121. Let us see what levels we see in the coming days.

The stock is nearing its 52 week low of 110. The Volume was much higher and so was the delivery volume. Yesterday we saw the delivery volume was about 15 lacs shares today we see it has gone upto 25 lac shares. That means someone is buying more and more qty as retailers are panicking and selling. The professional traders are beating down the price lower and lower trying their best to create panic so that they can buy at wholesale prices.
Check how the intraday volume has grown from 44 lacs to 62 lacs shares traded. Check the 2 weeks high is at 140.80 and low is at 118.50
Let us see what option data is telling us
The 127.50 to 135 price level on option chain seem to show lot of trades being unwound on CALL side, why is that so? 125 has added more open interest than any other CALL. Does that mean that the stock is going to remain subdued between 110 and 125 level in the coming days? May be, I don't know.
On the PUT side, I see fresh positions being taken between 110 and 100 levels and the DITM PUTS are showing unwinding. This seems to be creating a window of 100-130
The 110 level is still holding fort as we see highest open interest PUT additions there.
Some more snapshots of this stock
ATR is increasing as you can see in the image above. Professional traders are pouncing on the retailers to sell in panic so that they can buy at lower prices.
The yesterdays VWAP price being 120.17, Keeping in mind the approximation of 5 points ATR from the VWAP price and the downside pressure being more currently. Key prices levels I would be watching to place my trade today is 112 to 115 on the downside and 119 to 122.40 on the upside.
Edit: 10-May-19
Yesterday I had mentioned about key levels to watch for the day. It turns out that our stock respected those levels. It opened at exactly the same price where it closed on the previous day that is at 118.75 I had mentioned that the selling pressure will see the stock going down upto 115/112, but you know what, I was wrong in that guess. However I also had mentioned that on the upper side it may go upto 122.40 and the stock did try to touch our price. Have a look...
Check the traded volume and the delivery qty. Keep close watch on those figures in the coming days. Right now all that I can say is that the short-sellers / sellers are in a state of pain because they really want the stock to go down.
Lets see what the option data is telling us.
Highest unwinding of open positions can be seen at 135 CALL and similarly 115 PUT seem to show some unwinding as we see the trades are high but the open interest has not added up. This means that those who wrote those options are unwinding their positions.
The stock seem to be going for 115 on the downside and 135 on the upside in the coming sessions. Lets see how it plays out.
Trading range today is likely to be 117.60 to 127.40
Edit 12-May-19
On Friday we saw the stock trading in a tight range.
It opened at 120.50 which was .25 lower than previous close of 120.75. It went down .90 ps at 119.60
and started moving up to 122.95 but spent the rest of the day deciding what to do as both the buyers and sellers were unsure of the stocks next likely move. It remained within that range and closed at 120.50
Given below is the chart predicting the stocks likely next move....
 |
| Blue box indicates buyers overcoming sellers, Orange box indicates consolidation range, Green lines indicate the likely path of the stock |
Check out the deliverable qty in the screen above.... it is 23 lacs shares as compared to 11 lacs shares on the previous day. Does that mean buyers are taking delivery of the stock as sellers are selling?
Here is the option chain data...
Look at 130 CALL showing highest traded volume and open interest unwinding. This happens to be the first sign that if markets remain positive then this stock might try to climb further from the current price of 120.75 to somewhere in the range of 129-135
However on the PUT side, unwinding is less prevalent, in fact it looks like writers have commenced writing OTM PUTS, check the range 120-100.
Trading levels for the coming week :
If the stock sustains above 122.50 without breaking 118, we are likely to witness a 10 point move from the CMP 120.50 to upto 129.90 / 134.90
Lets see how it turns out.
Happy trading !!!
Mail me TradewithLS@gmail.com if you wish to get trained in my trading strategies.